Dashboard
Dashboard is the section where you can find the analytics and tracking of all your chatbots and users. There are five basic reports available:
- Users Report
- Daily Active Users
- Analytics Report
- Comment Reply Report
- WhatsApp Analytics Report
- Inbox Analytics Report
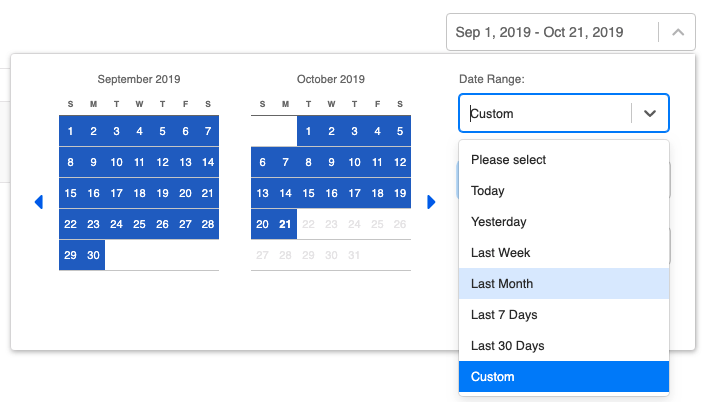
For every type of dashboards, you are able to filter a time range, and view the analytics within a certain period by using the Date Picker at top right. You can use the pre-defined filter such "Today", "Last Week", "Last 7 Days", etc.
NOTE
- The default date range is "Month-to-date", which starts from the first day of the current month to the current day.
- The maximum limit of the date picker is "365 days".
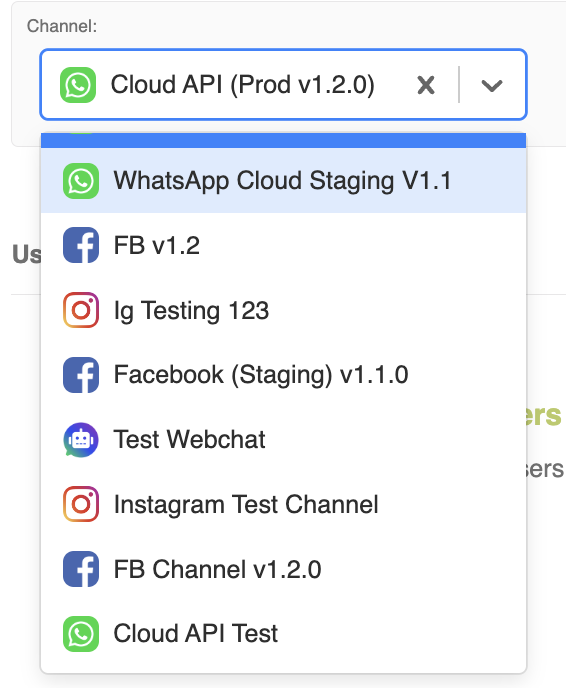
You are able to filter the dashboards by the channel, and view the analytics specifically from a certain channel in your organization.
NOTE
- A channel will be pre-selected by default, you can select other channel available in the app.
- Only one channel can be selected at one time.
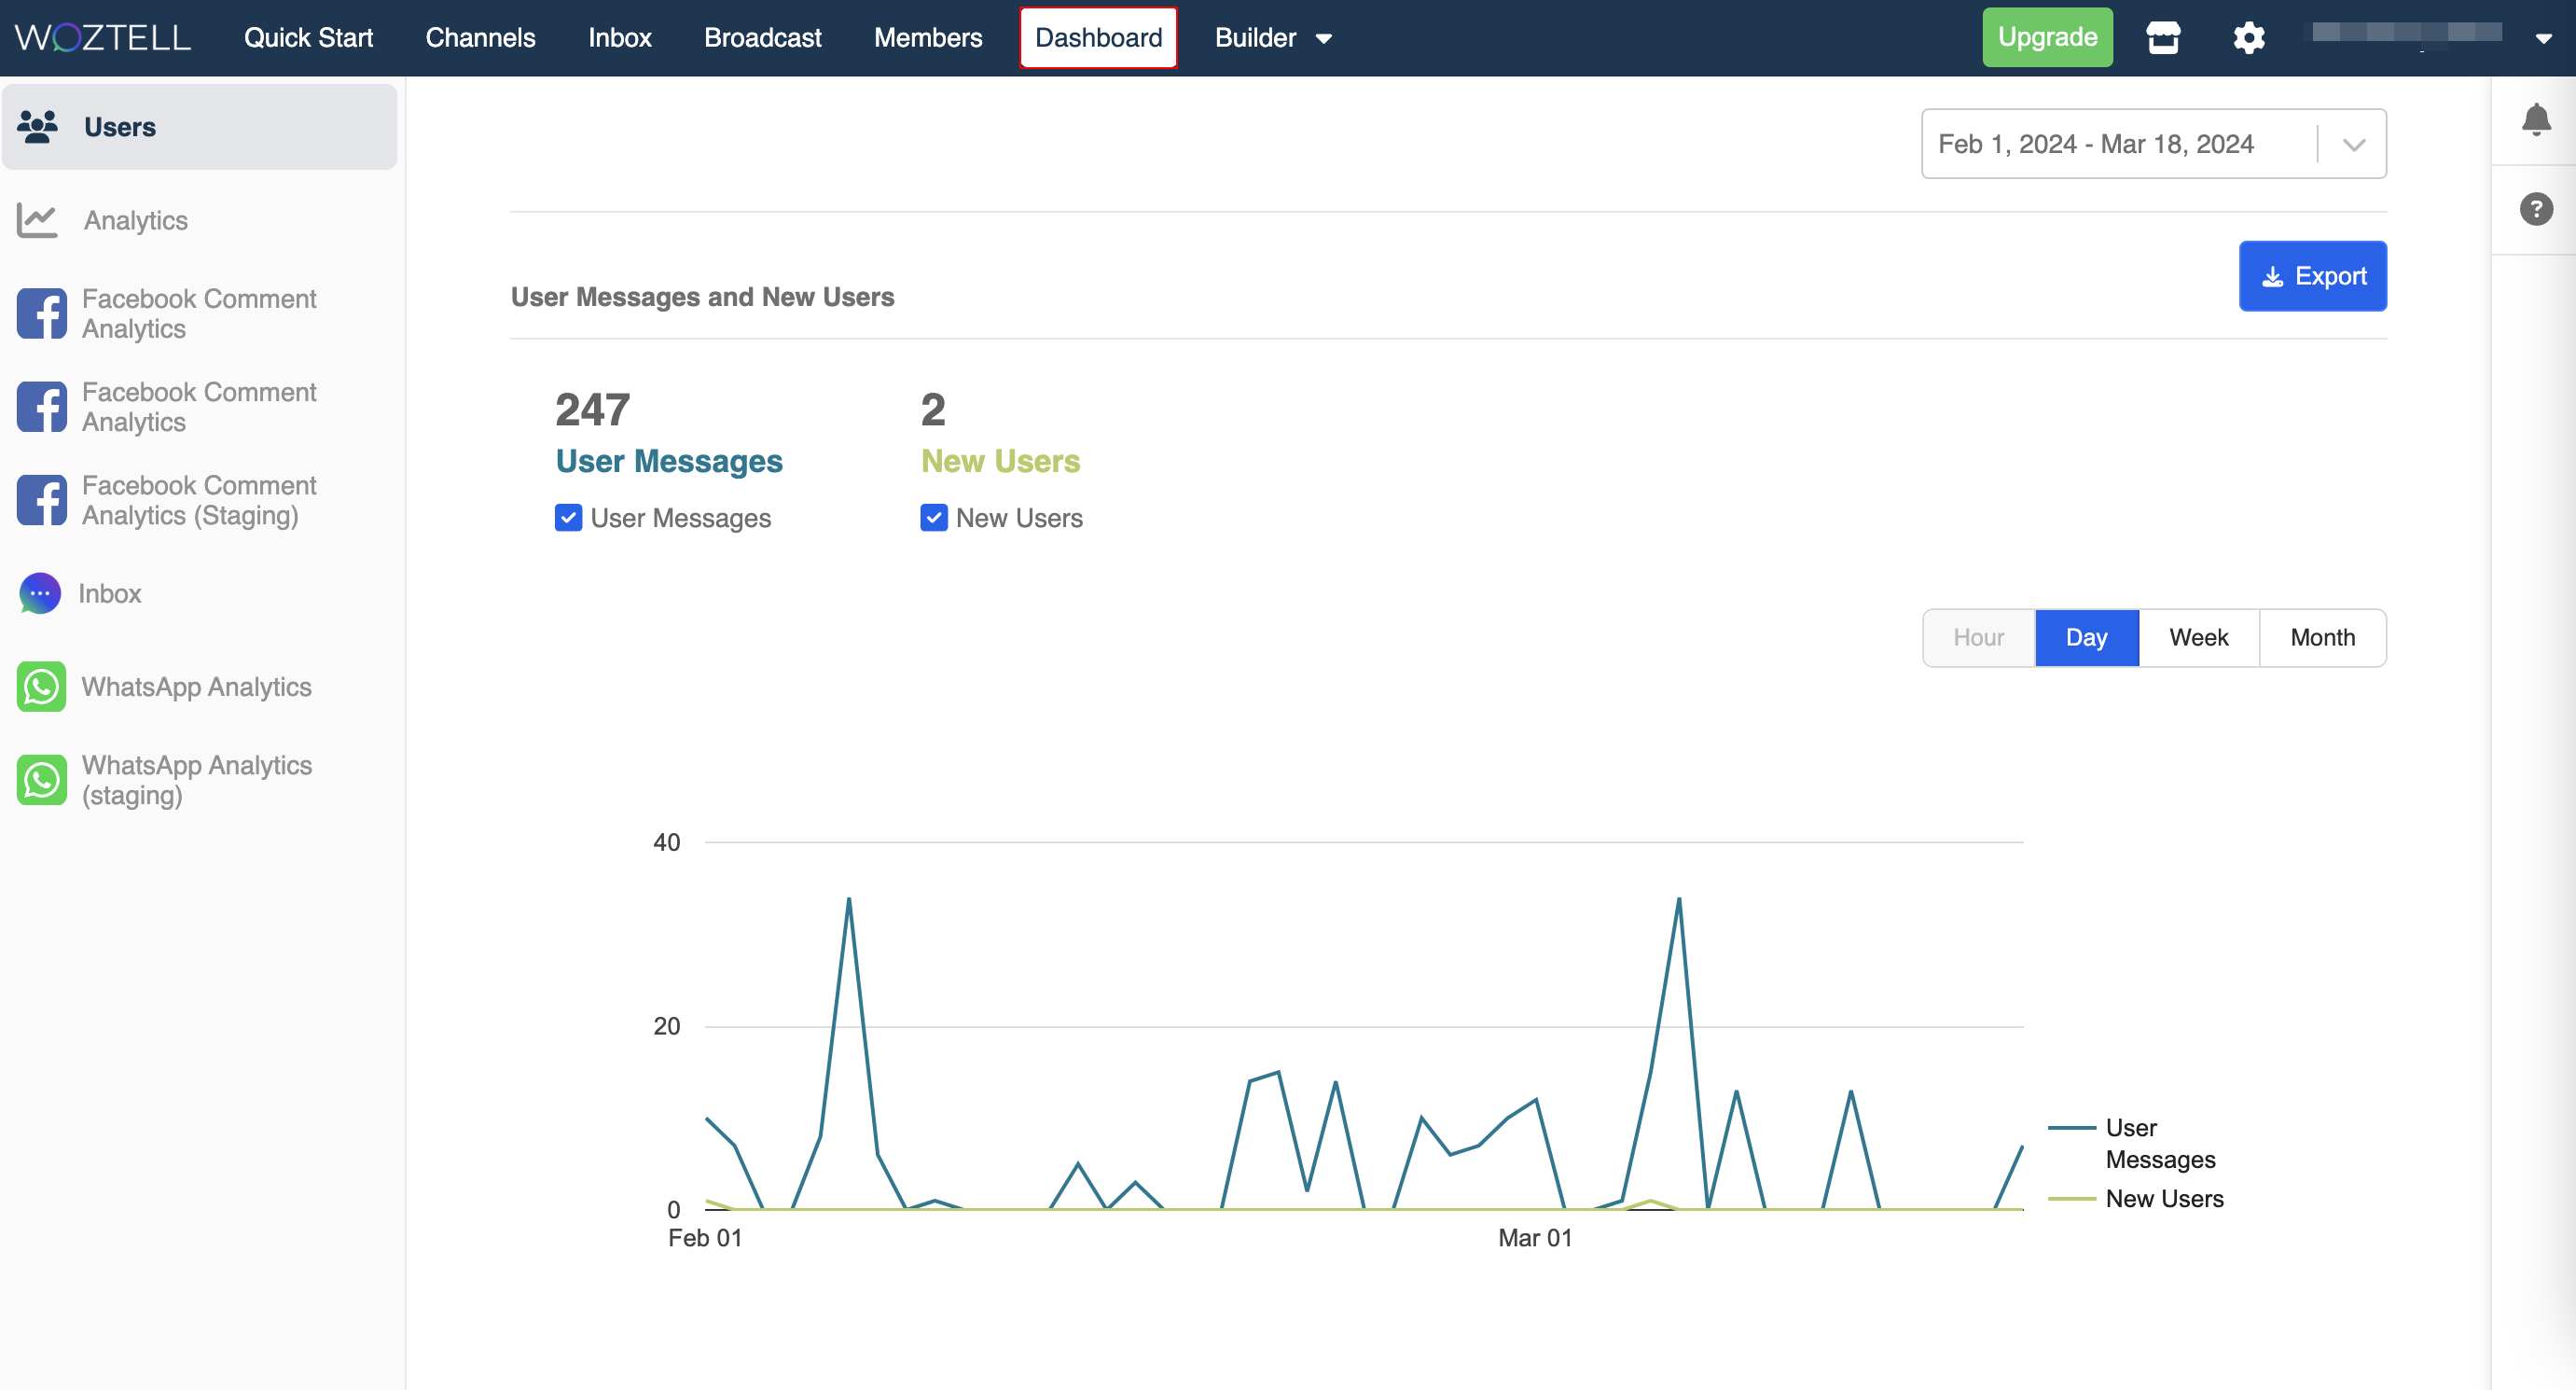
Users
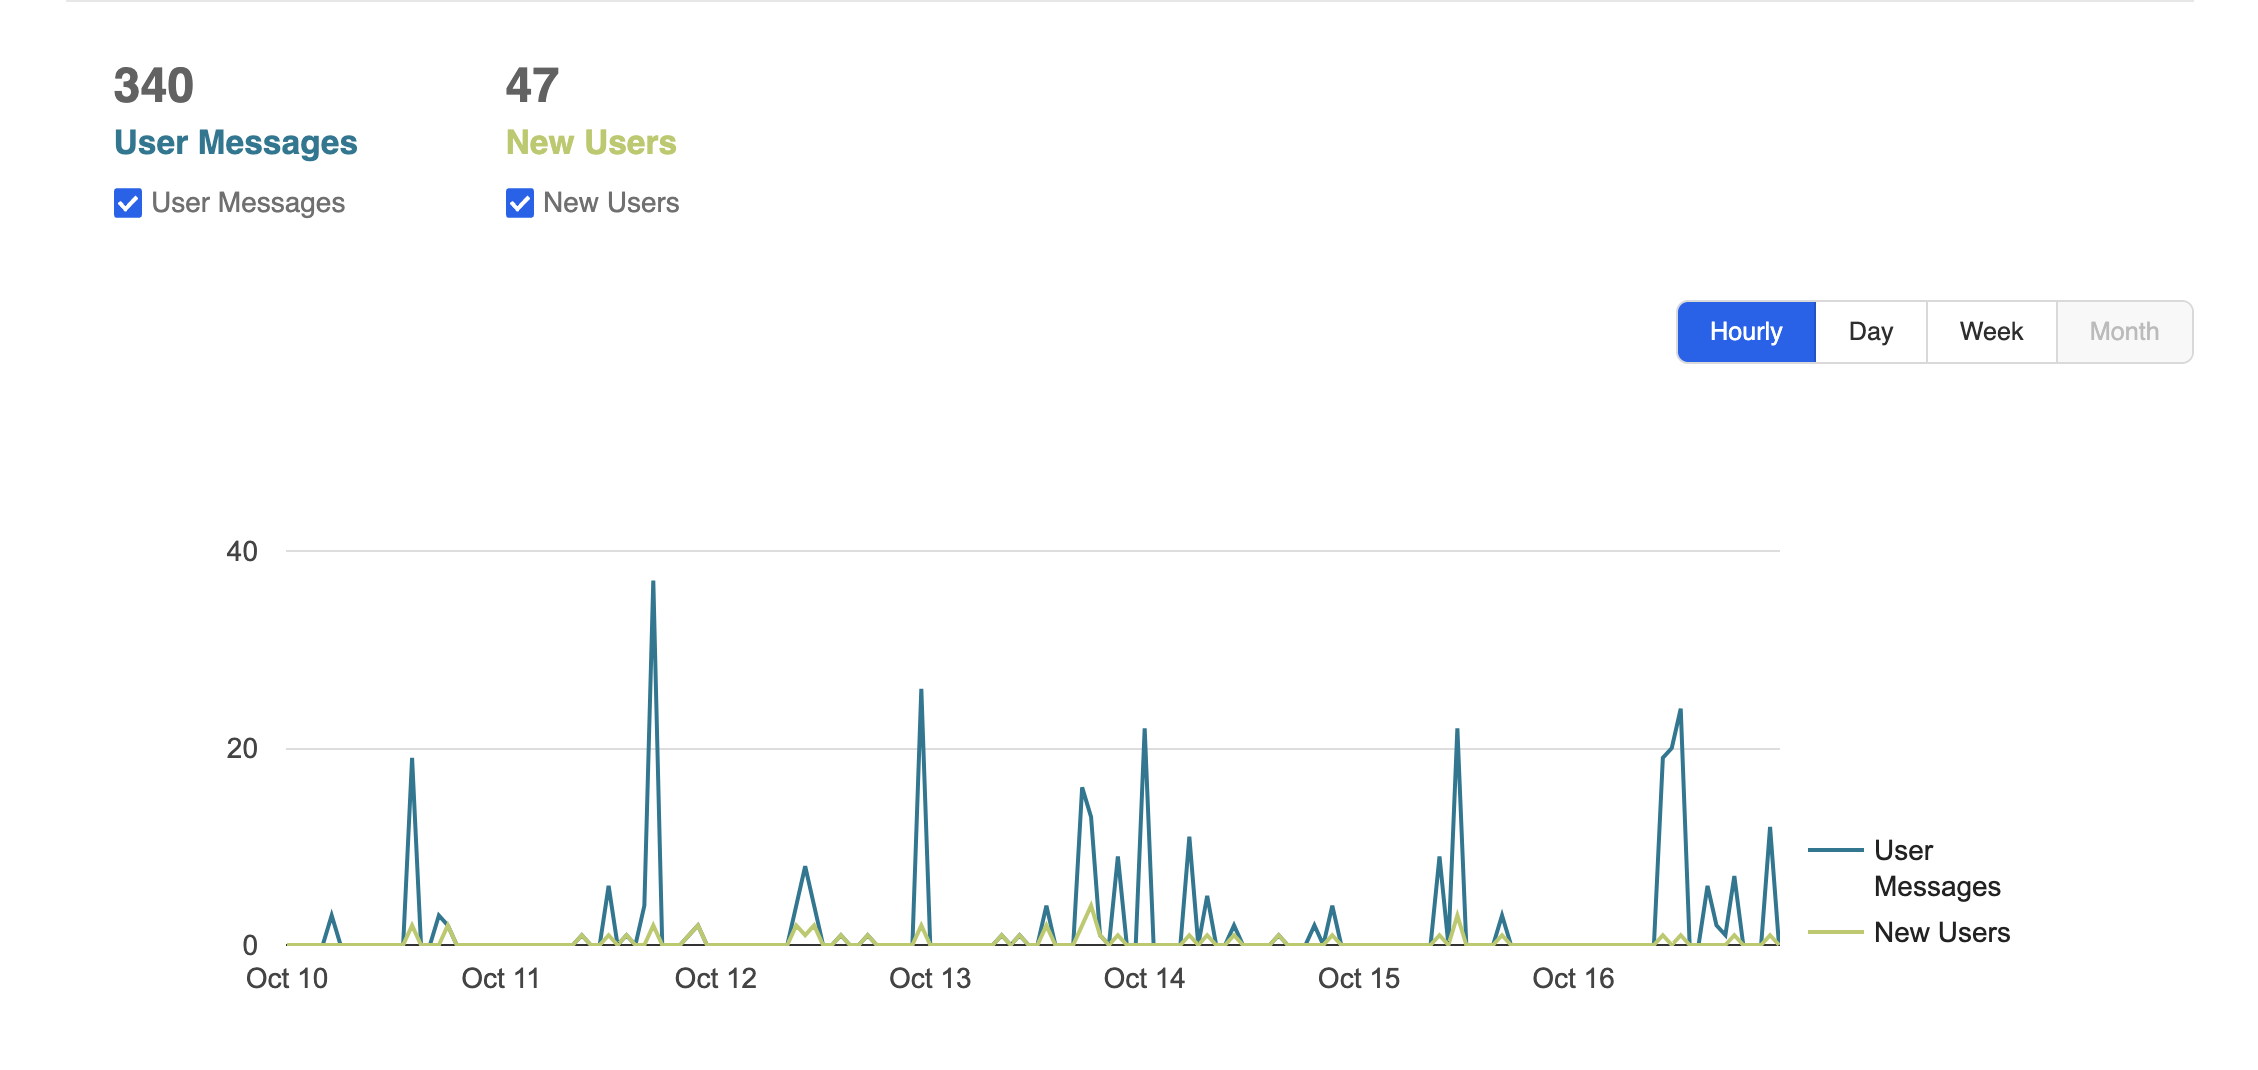
Users present the chatbot performance in terms of new members and user interactions.
You will be able to read the following data:
| Data Type | Definition |
|---|---|
| User Messages | The number of user interactions with you within the selected time period, including any types of user input |
| New User | The number of users who interact with you for the first time within the selected time period |
Daily Active Users
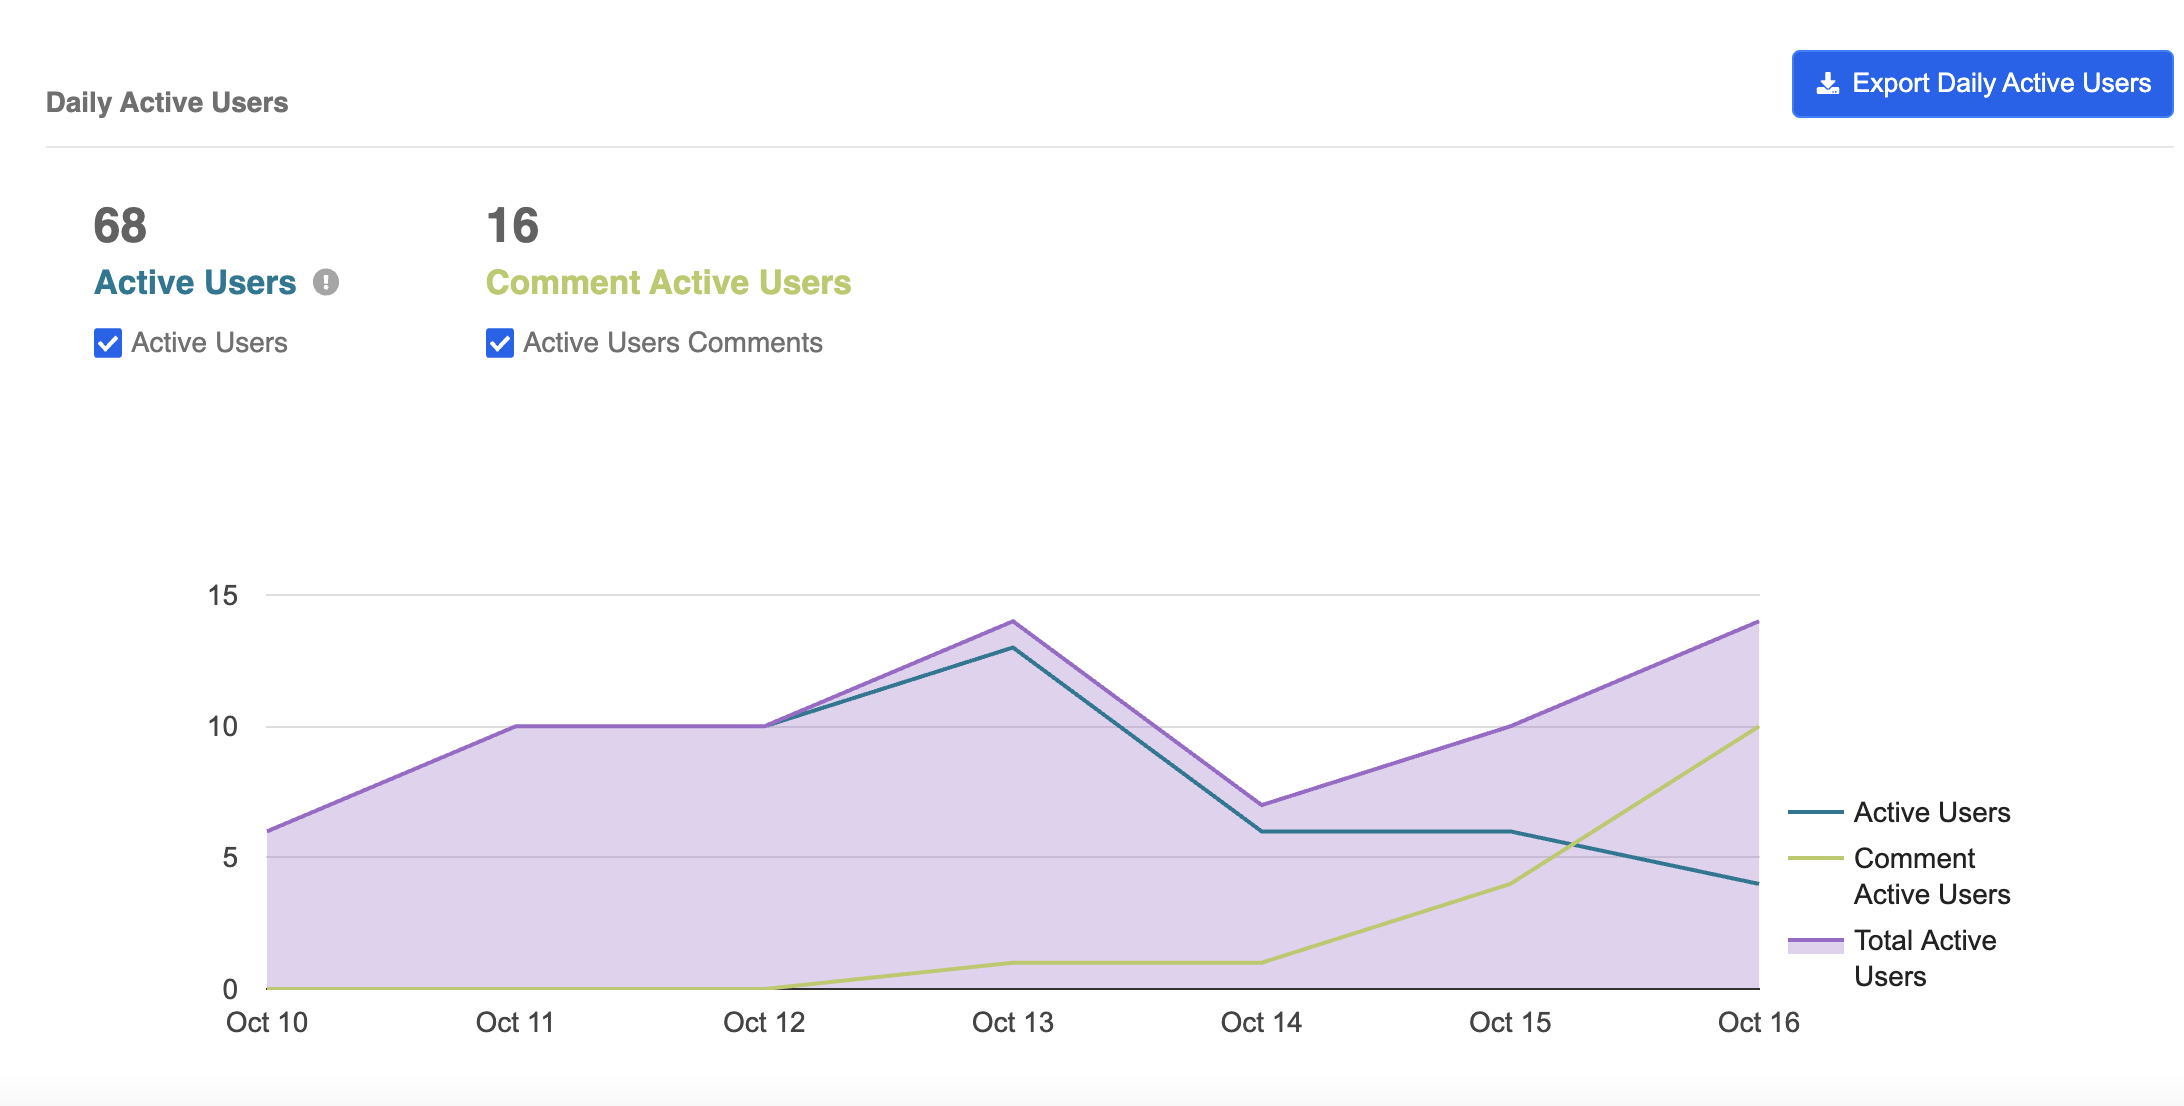
Daily Active Users presents the chatbot performancce on a daily basis and users can see the day-by-day changes of the reach.
You will be able to read the following data:
| Data Type | Definition |
|---|---|
| Active Users | The number of users who have performed at least one user action within the selected time period |
| Comment Active Users | The number of active users who have comment entry to your page within the selected time period |
Analytics
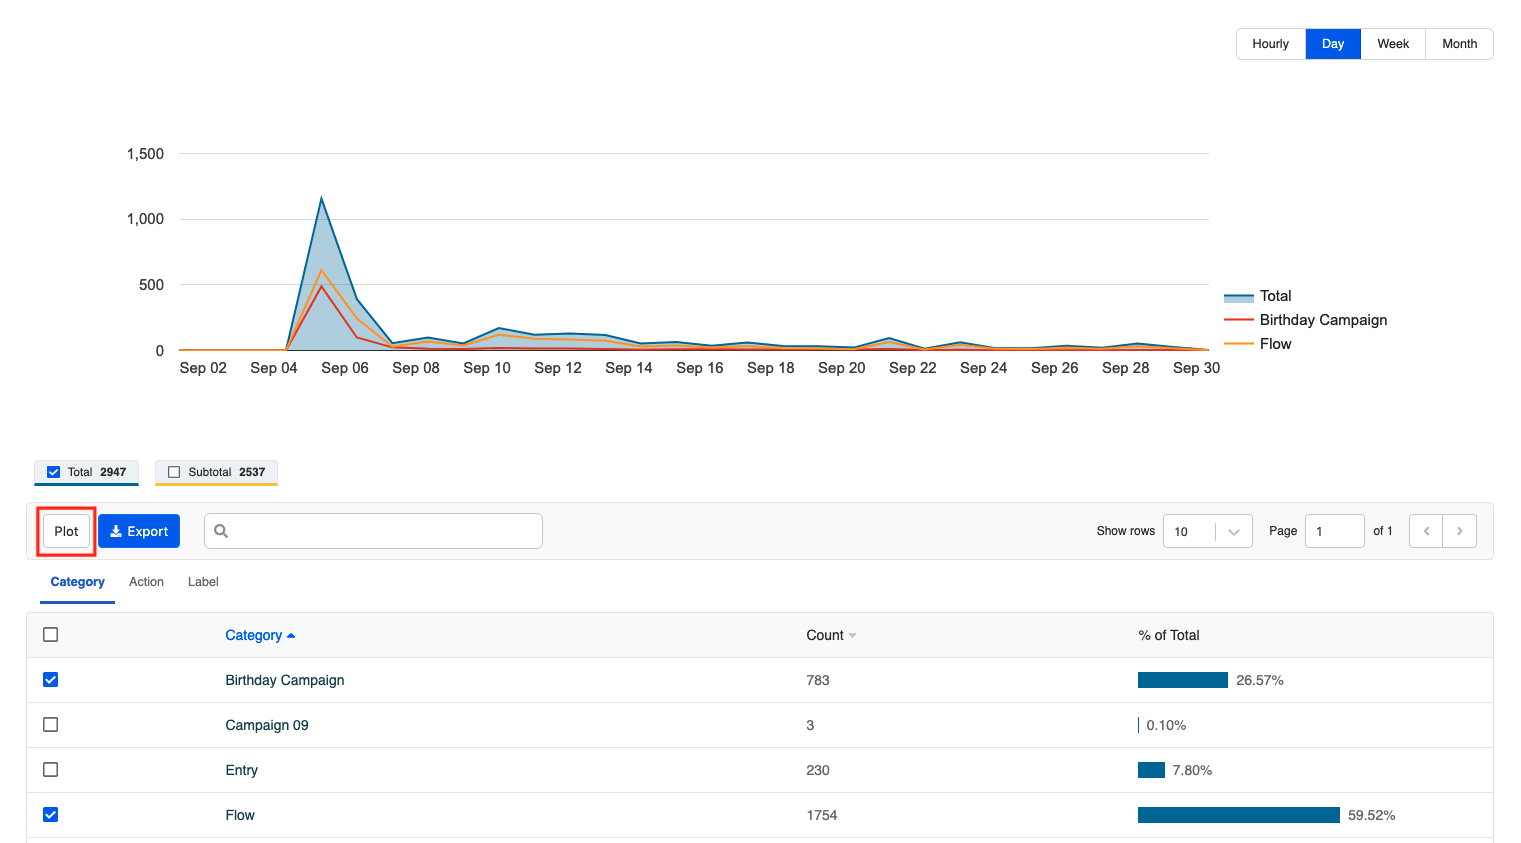
Analytics report shows all stored actions you've set in the analytics section. You can also tick the specific category, action or label and plot the data on the graph. Different data is displayed into different colors.
Click the button below to view your analytics:
Facebook Analytics
Comment Reply
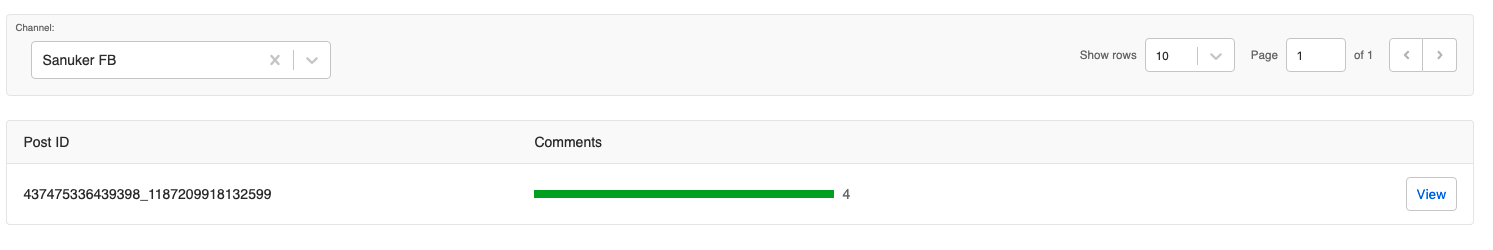
If you have created Public/Private Reply for your chatbots, you may read the comment reply analytics of each post after adding the pre-action to save users' comment. You will be able to see the list of all posts that receive users' comments, the total number of comments received and the distribution of the comment status.
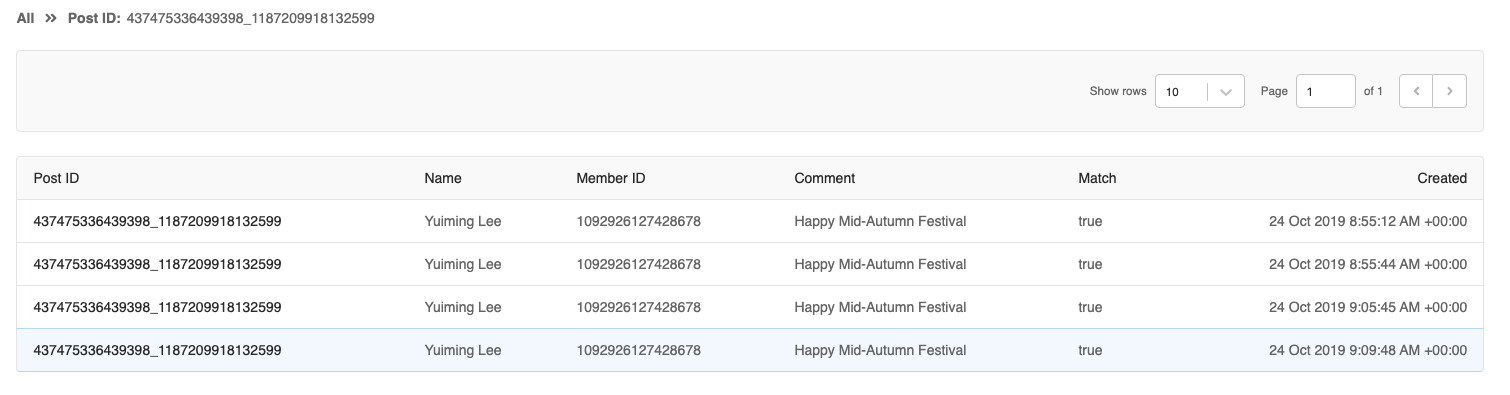
Once you clicked the "View" button into a specific post, you can read a detailed list of all users who have left comments on that specific post and their corresponding comment. You can also identify if the comment is matched or not.
You can view your comment reply report here.
Click the button below to view your comment reply report:
WhatsApp Analytics
This report shows you the performance of your WABA in terms of outbound messages and conversations.
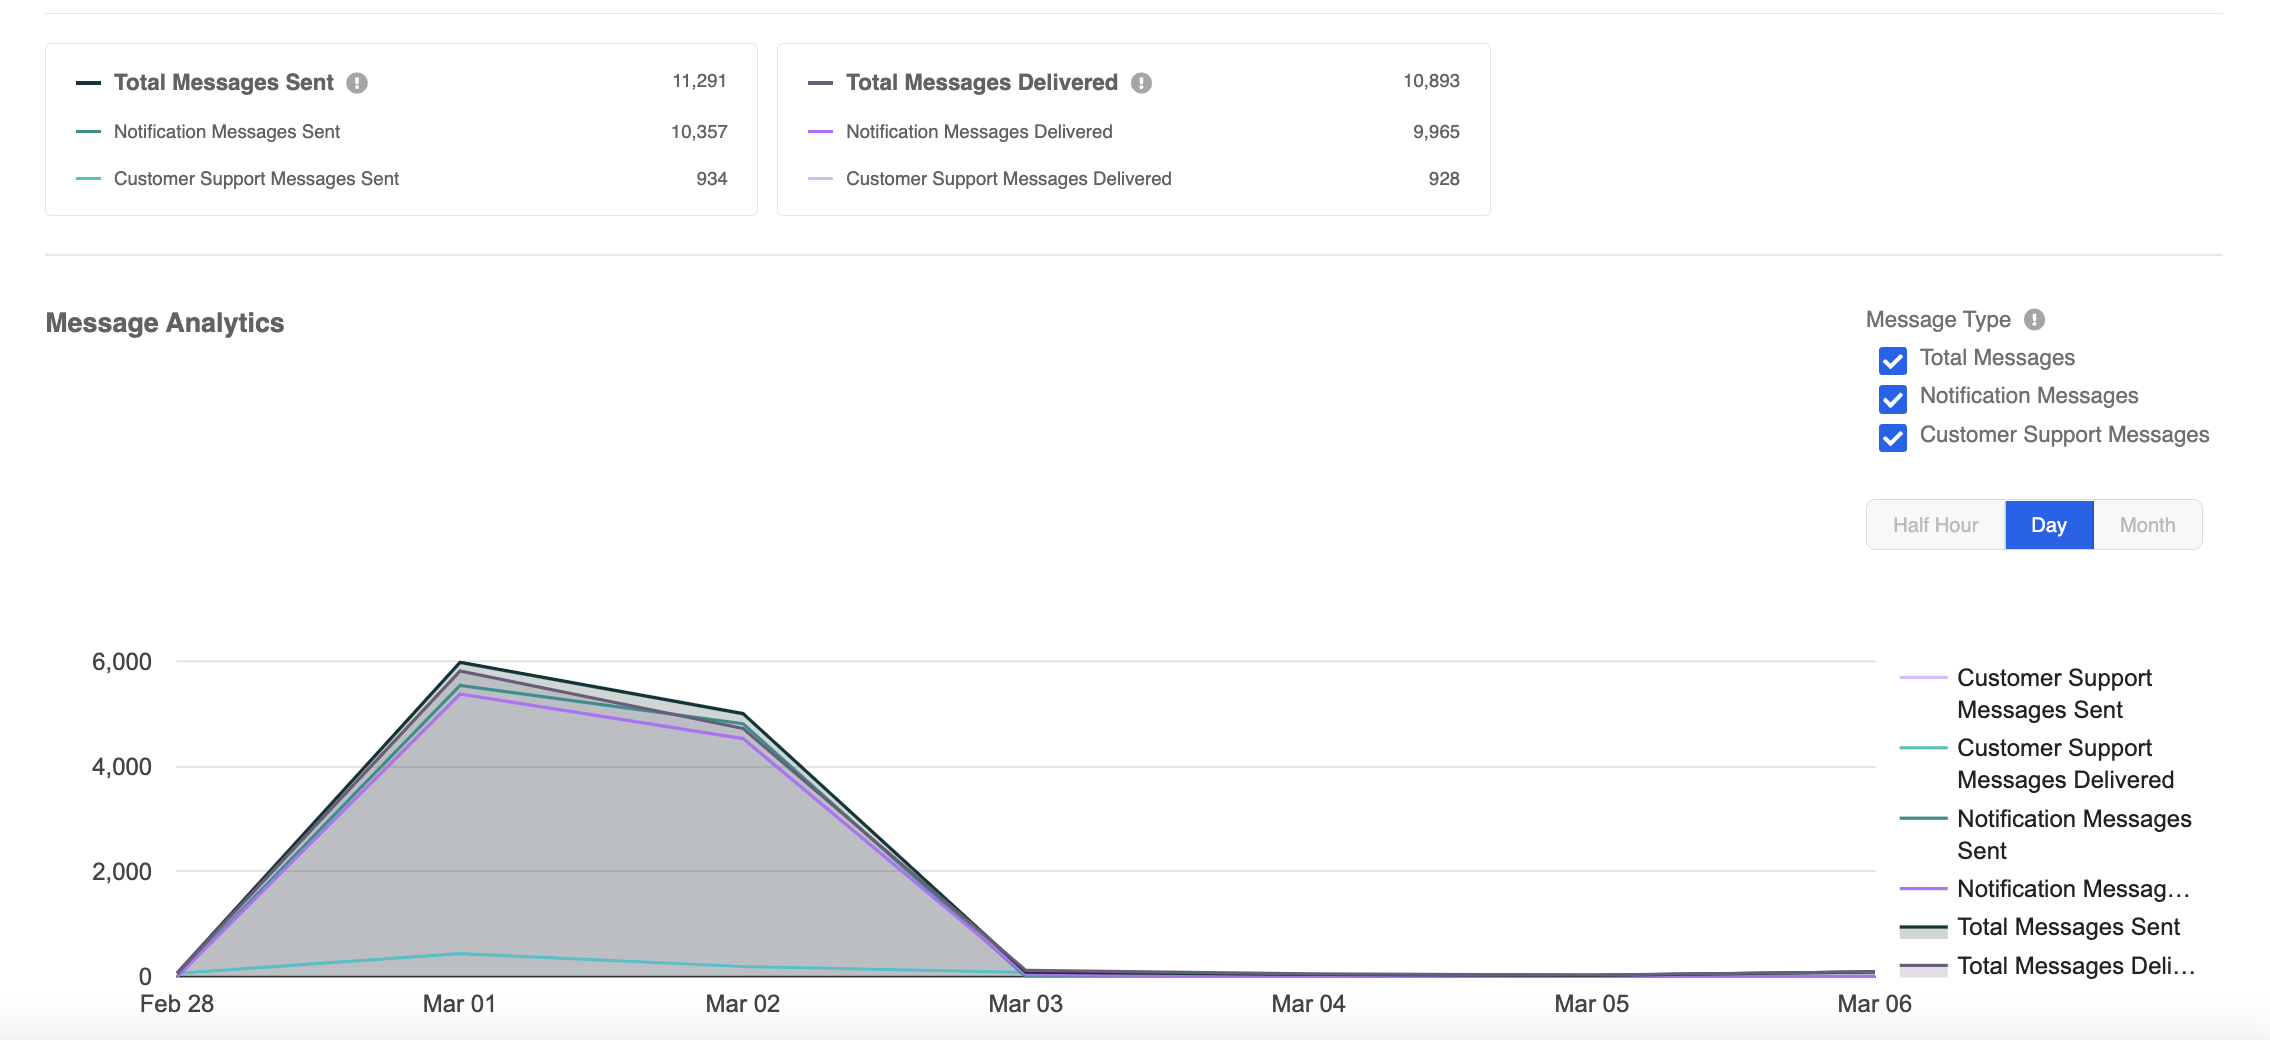
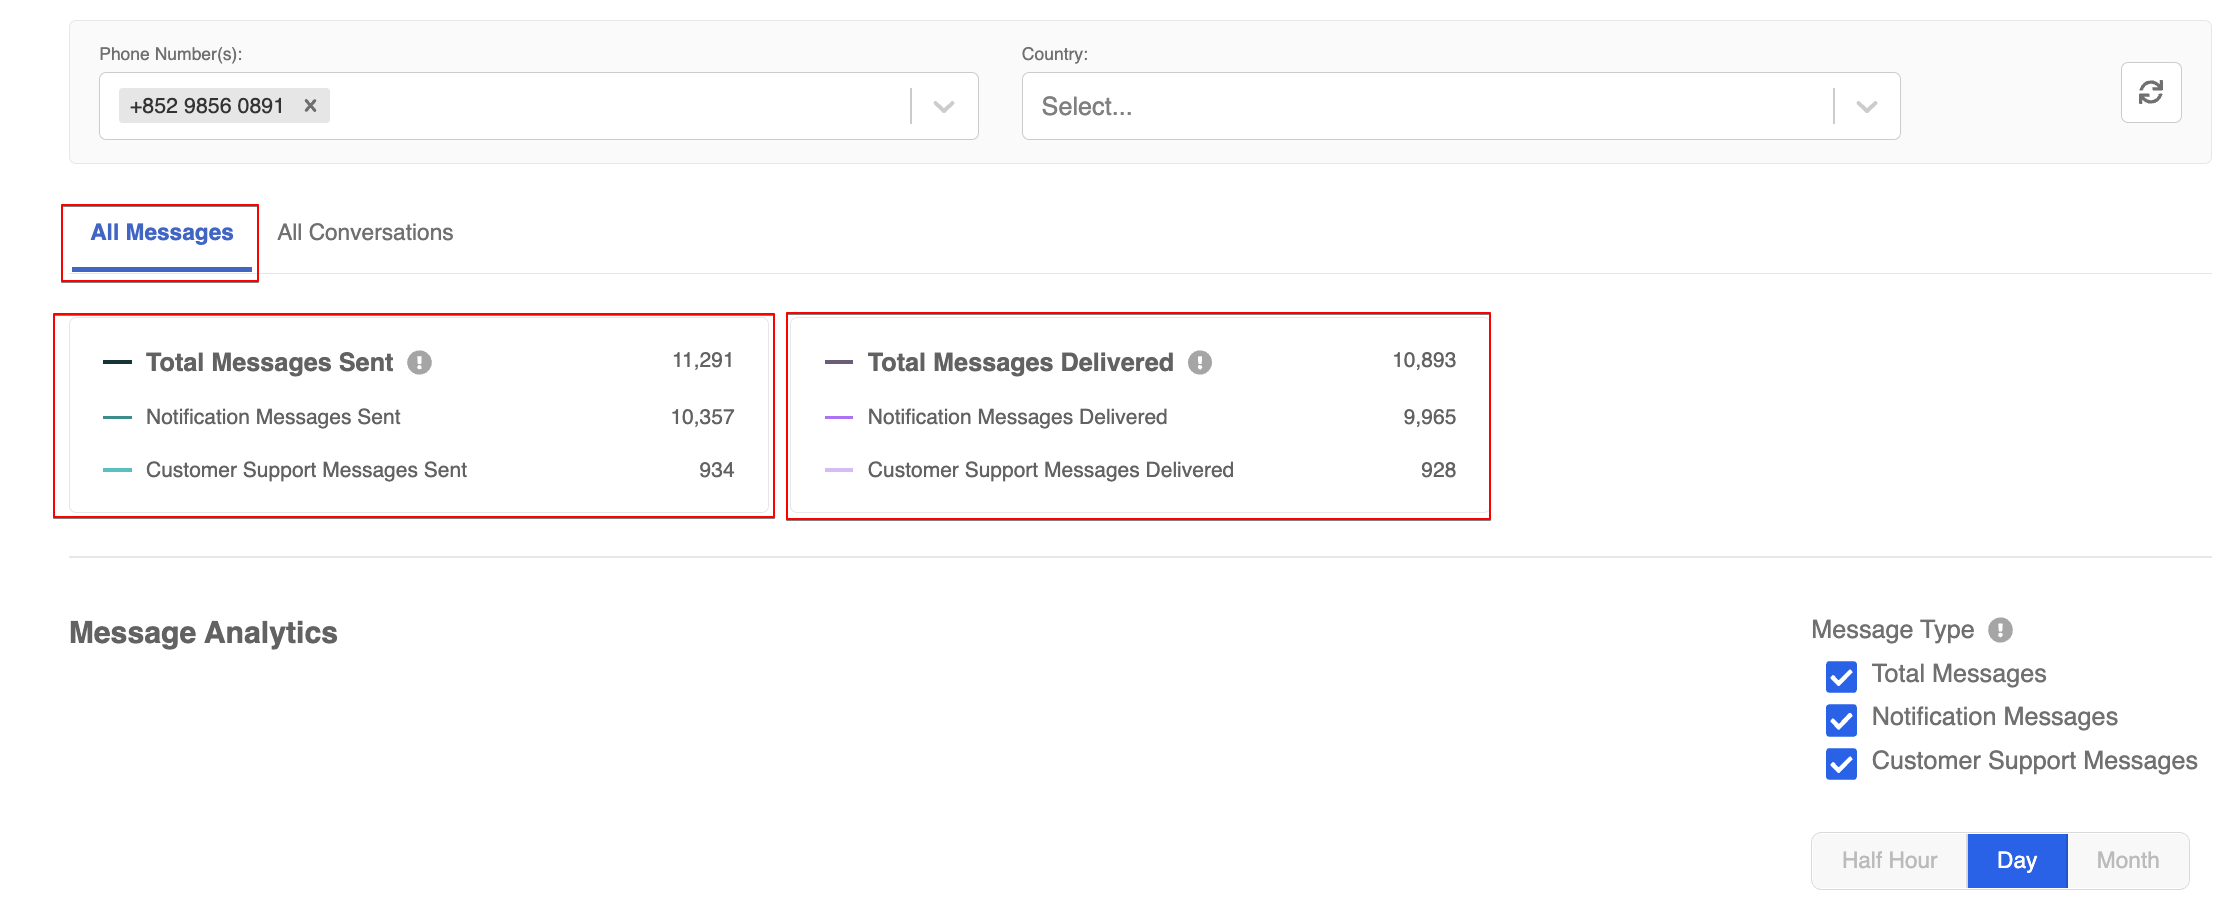
Messages Sent
This is the WhatsApp Analytics based on outbound messages that have been sent and delivered to customers.
| Property | Description |
|---|---|
| Integration | The WABA integration you have set on Stella |
| Country | The region of the recipients' mobile phones |
| Phone Number(s) | The phone numbers that are connected under the corresponding WABA |
| Total Messages Sent | The messages sent from your WhatsApp Business phone number(s) |
| Total Messages Delivered | The message received by your recipients on their mobile phone(s) |
| Notification Messages | Templated Messages sent outside the 24-hour window |
| Customer Support Messages | Session messages sent within the 24-hour window |
tip
There are a few reasons causing the discrepancy between the number of Total Messages Sent and the number of Total Messages Delivered, such as account blocking and poor data network. The total number of messages delivered should always be equal to or less than that of messages sent.
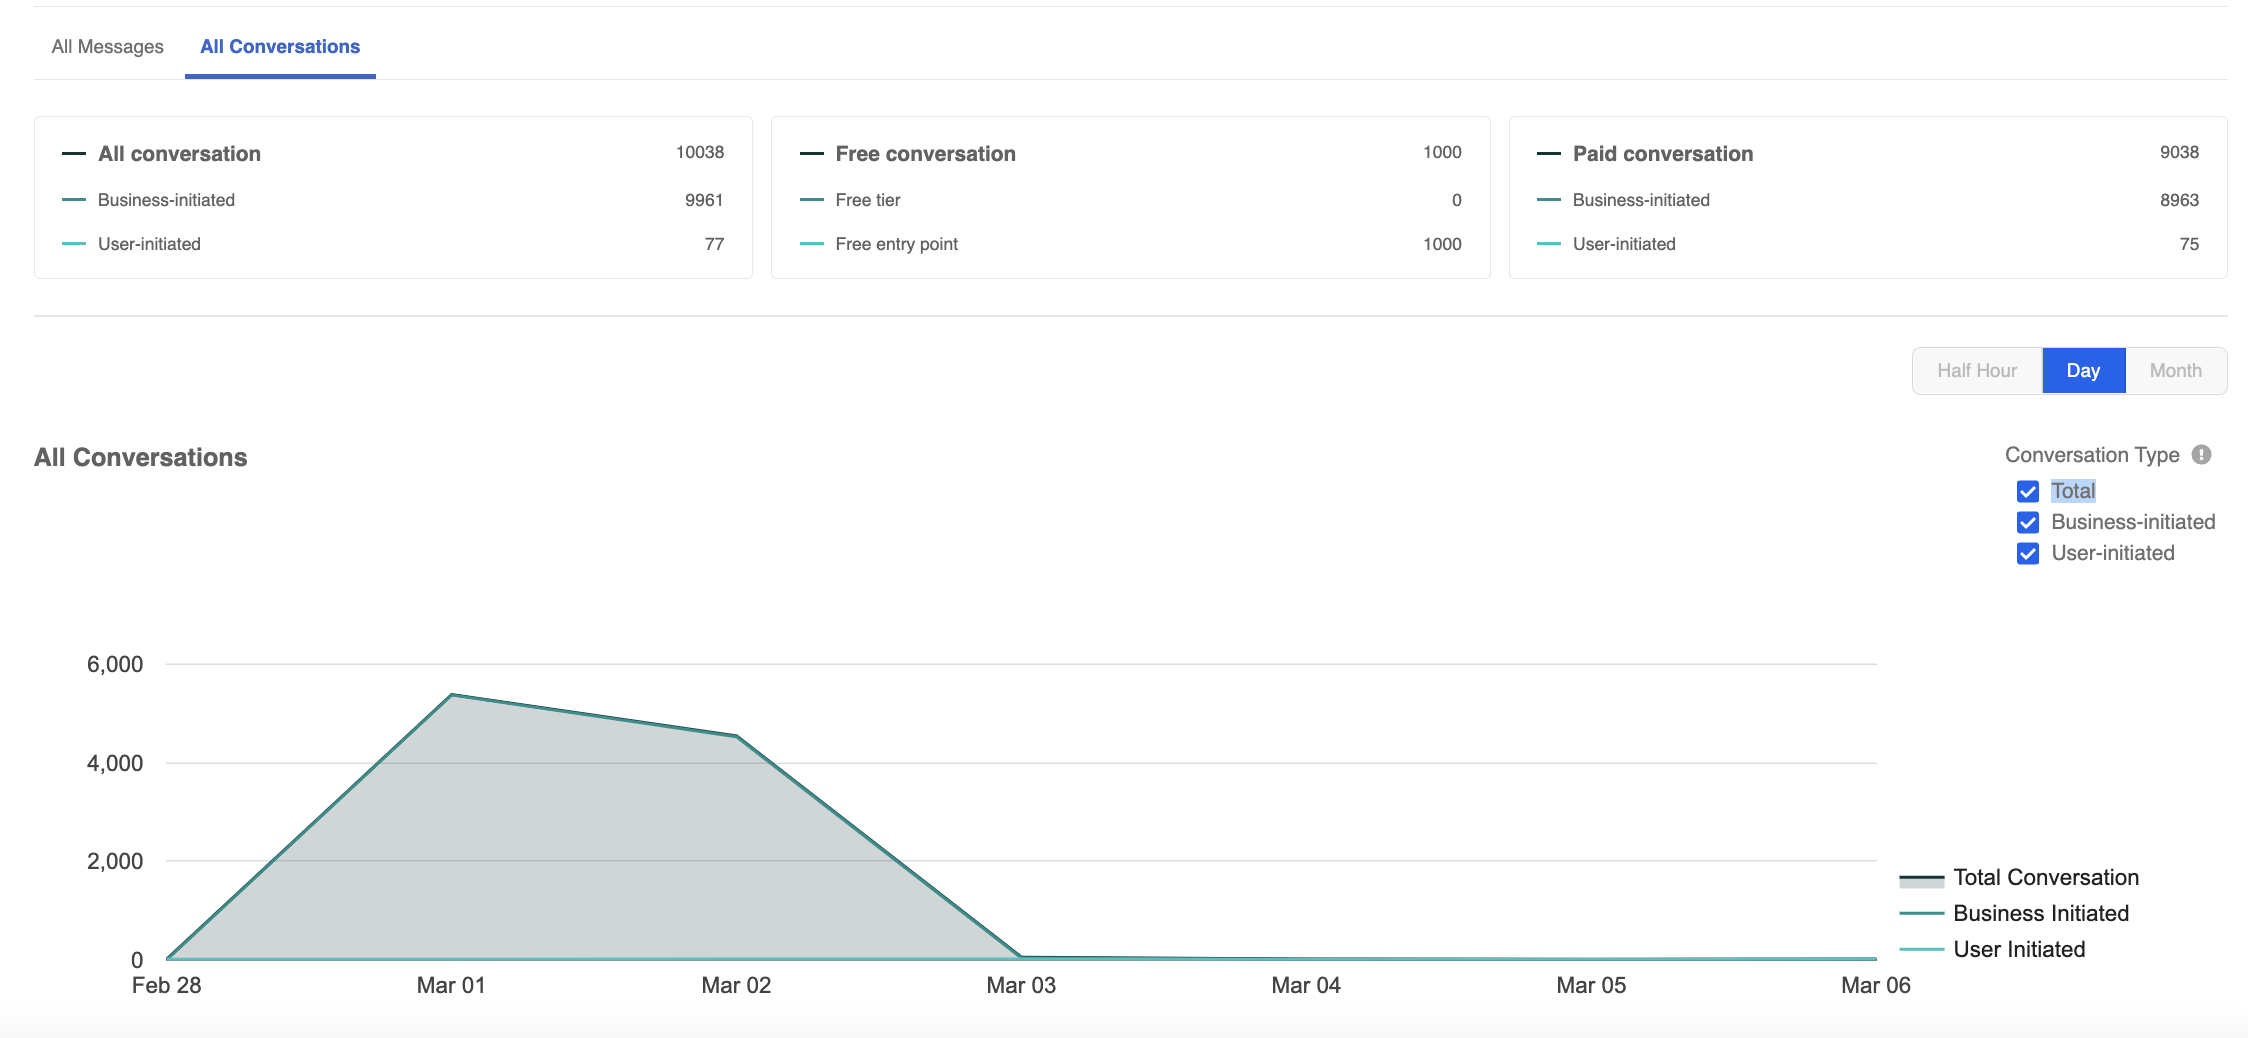
Conversations
Conversations is the WhatsApp Analytics that is determined by the Conversation-based Pricing Model.
| Property | Description |
|---|---|
| Integration | The WABA integration you have set on Stella |
| Country | The region of the recipients' mobile phones |
| Phone Number(s) | The phone numbers that are connected under the corresponding WABA |
| Business-initiated Conversation | The conversation that initiates from a business sending a message to user outside the 24-hour window |
| User-initiated Conversation | The conversation that initiates in response to a user message within the 24-hour window |
| Free Tier Conversation | Each WABA account has 1000 free conversations per month, can be either user or business-initiated |
| Free Entry Point Conversation | The first user-initiated conversation triggered by call-to-actions buttons, which will not be charged |
| Paid Conversation | Conversations that will be charged |
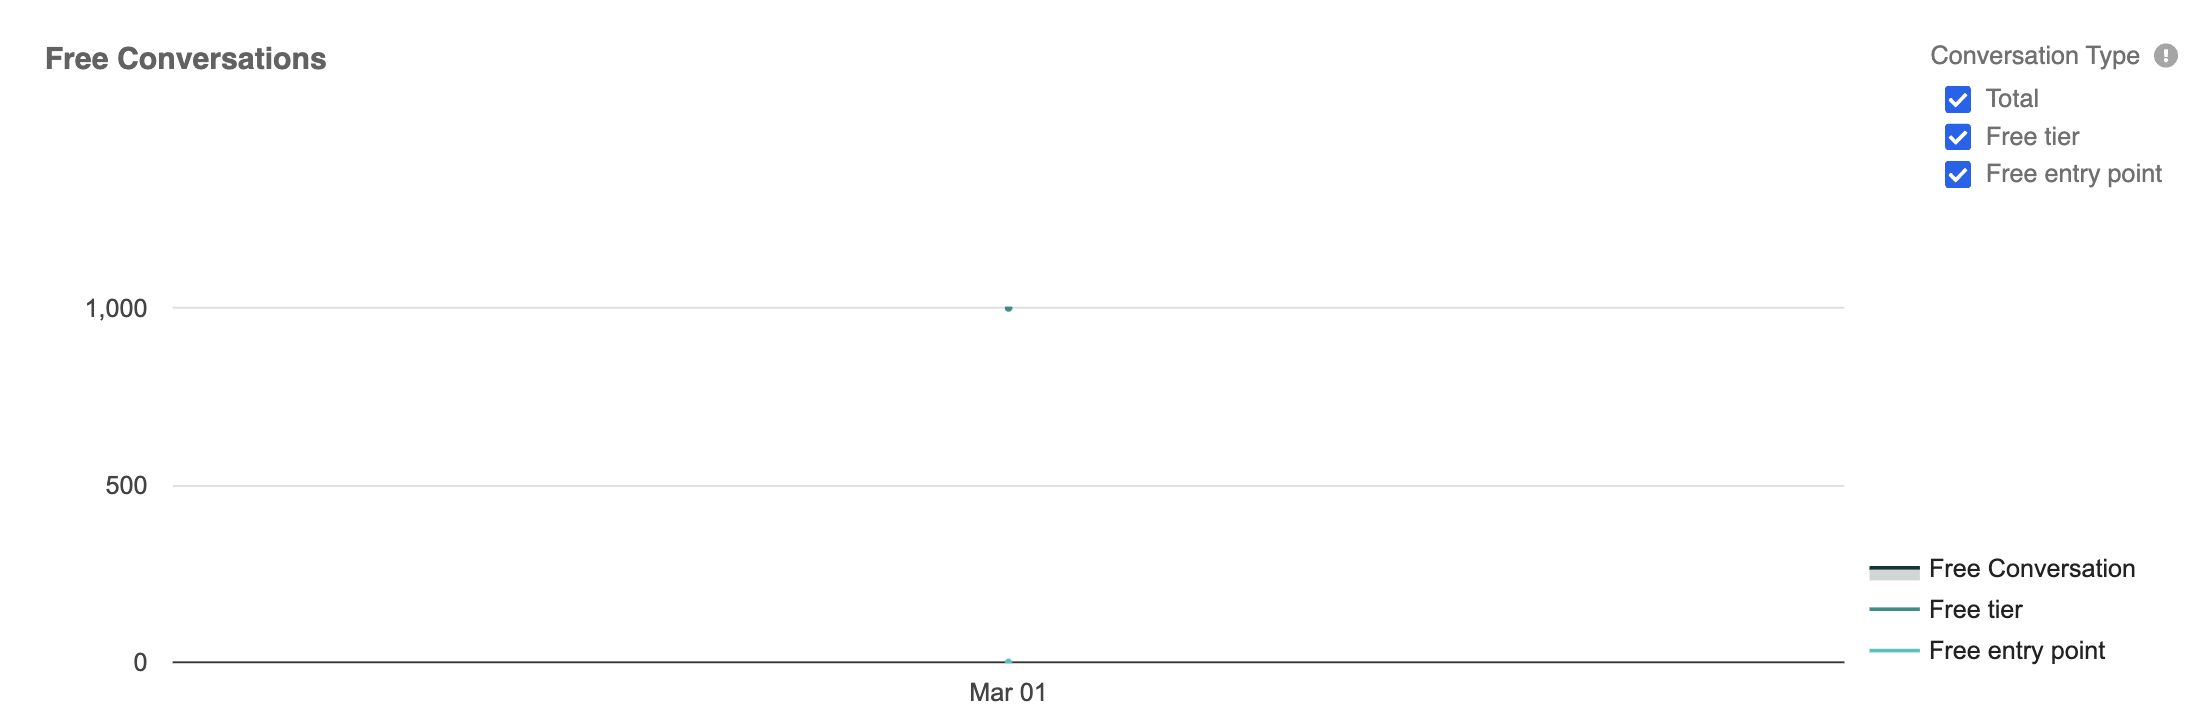
Free Conversations
This analytics present the data of Free Tier Conversation and Free Entry Point Conversation.
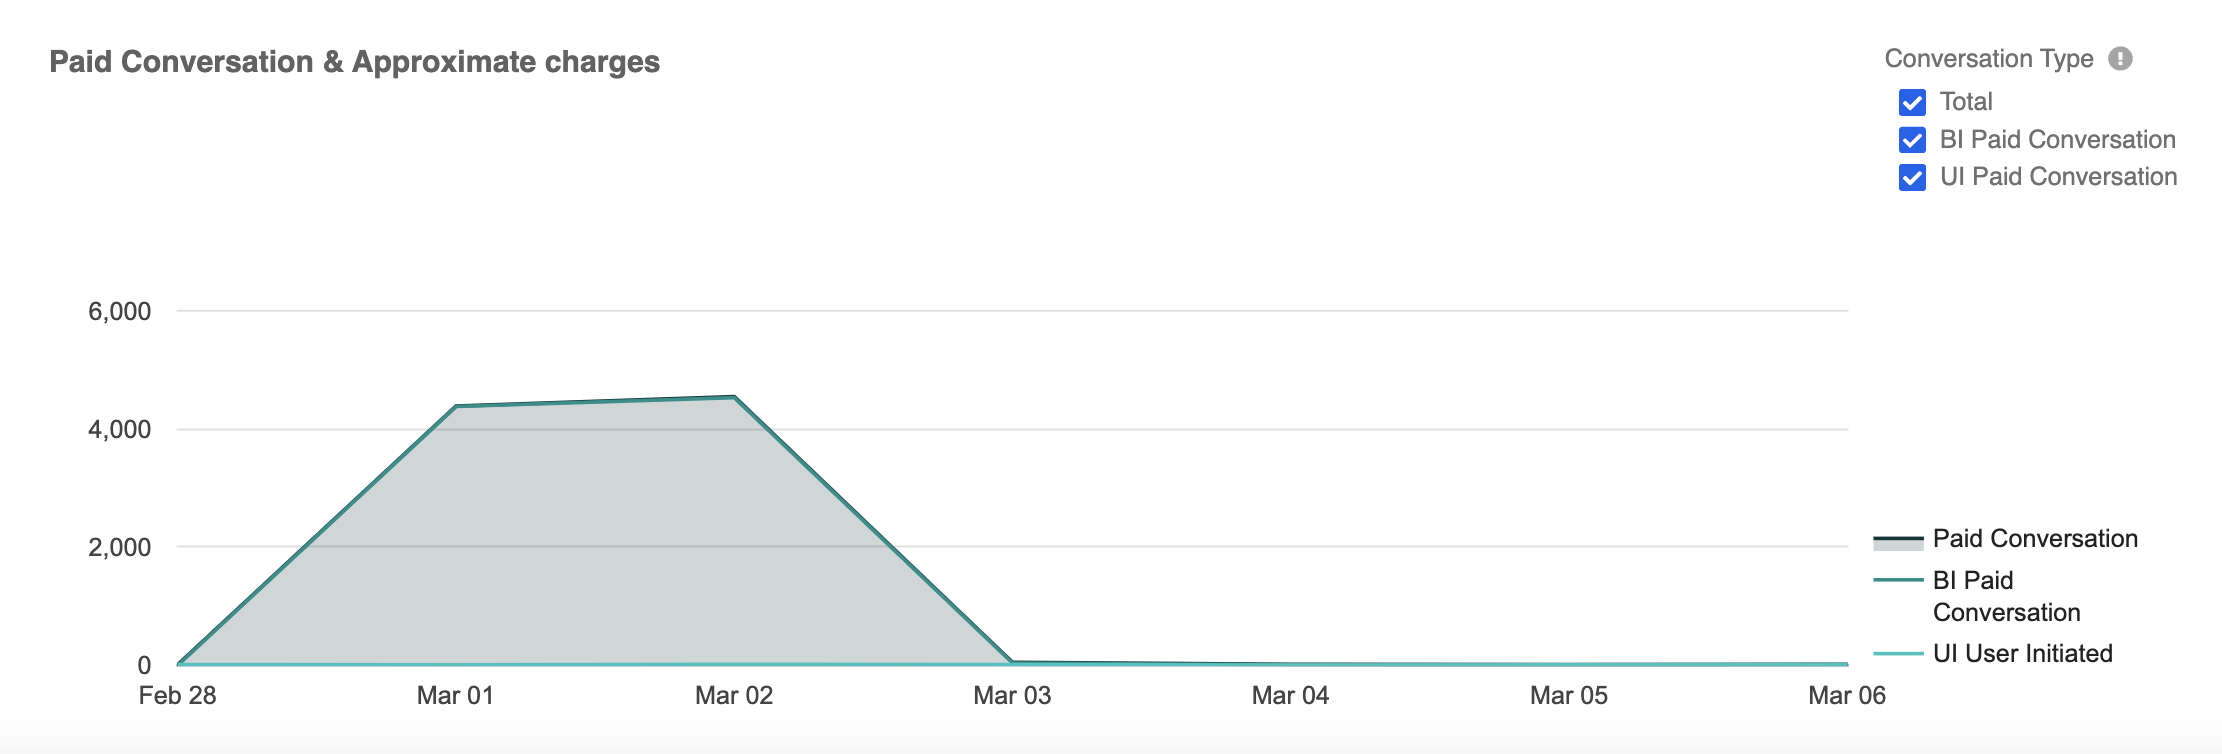
Paid Conversations
The following analytics present the data of Paid Conversations, which can be User-initiated or Business-initiated.
Inbox Analytics
This section is for presenting the metrics related to chat sessions and agent performance in the inbox. Please refer to here for details.